Project Overview
Due to the current public health situation there has been a radical shift of perception and safety in regards to public places having an impact both physically and psychologically. There is a need to visualize this change and reflect on the influence that it has in our daily interactions with our city. This visualization will also reflect in a good manner the challenges people have faced during this pandemic.
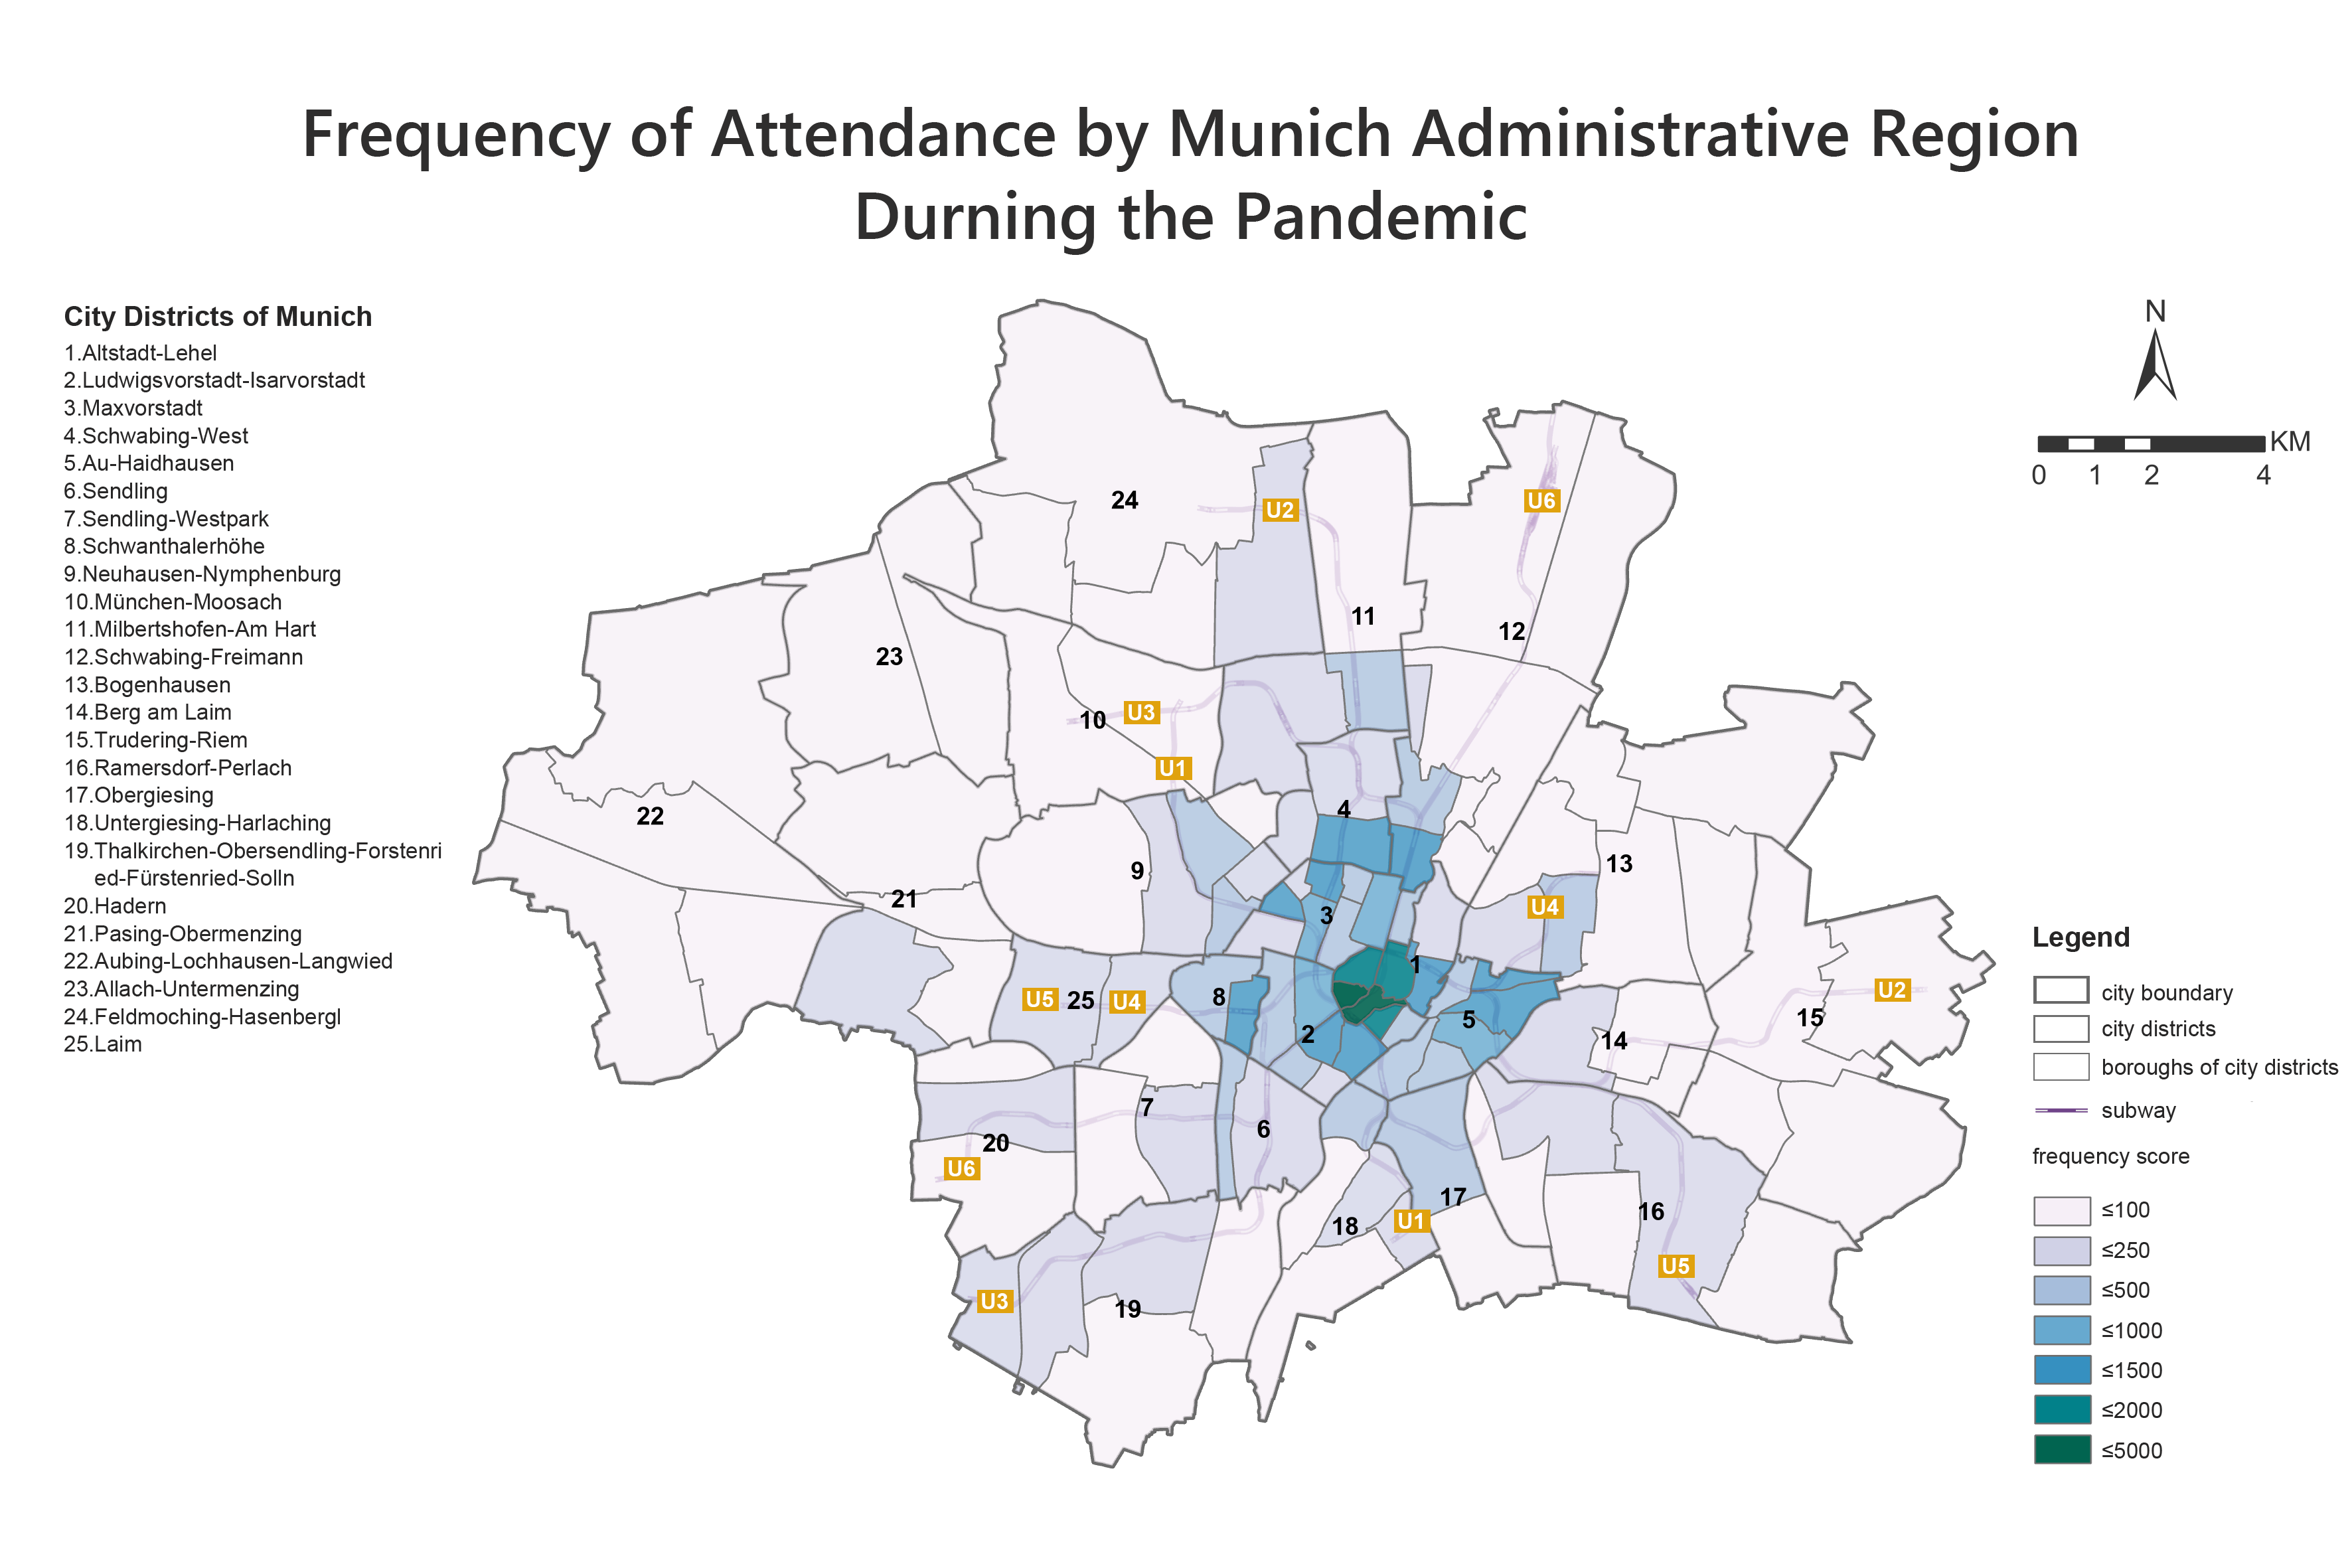
To best reflect and understand these changes that people have faced during this pandemic, we have used a series of “Before” & “After” choropleth maps to help tell the story.
Results
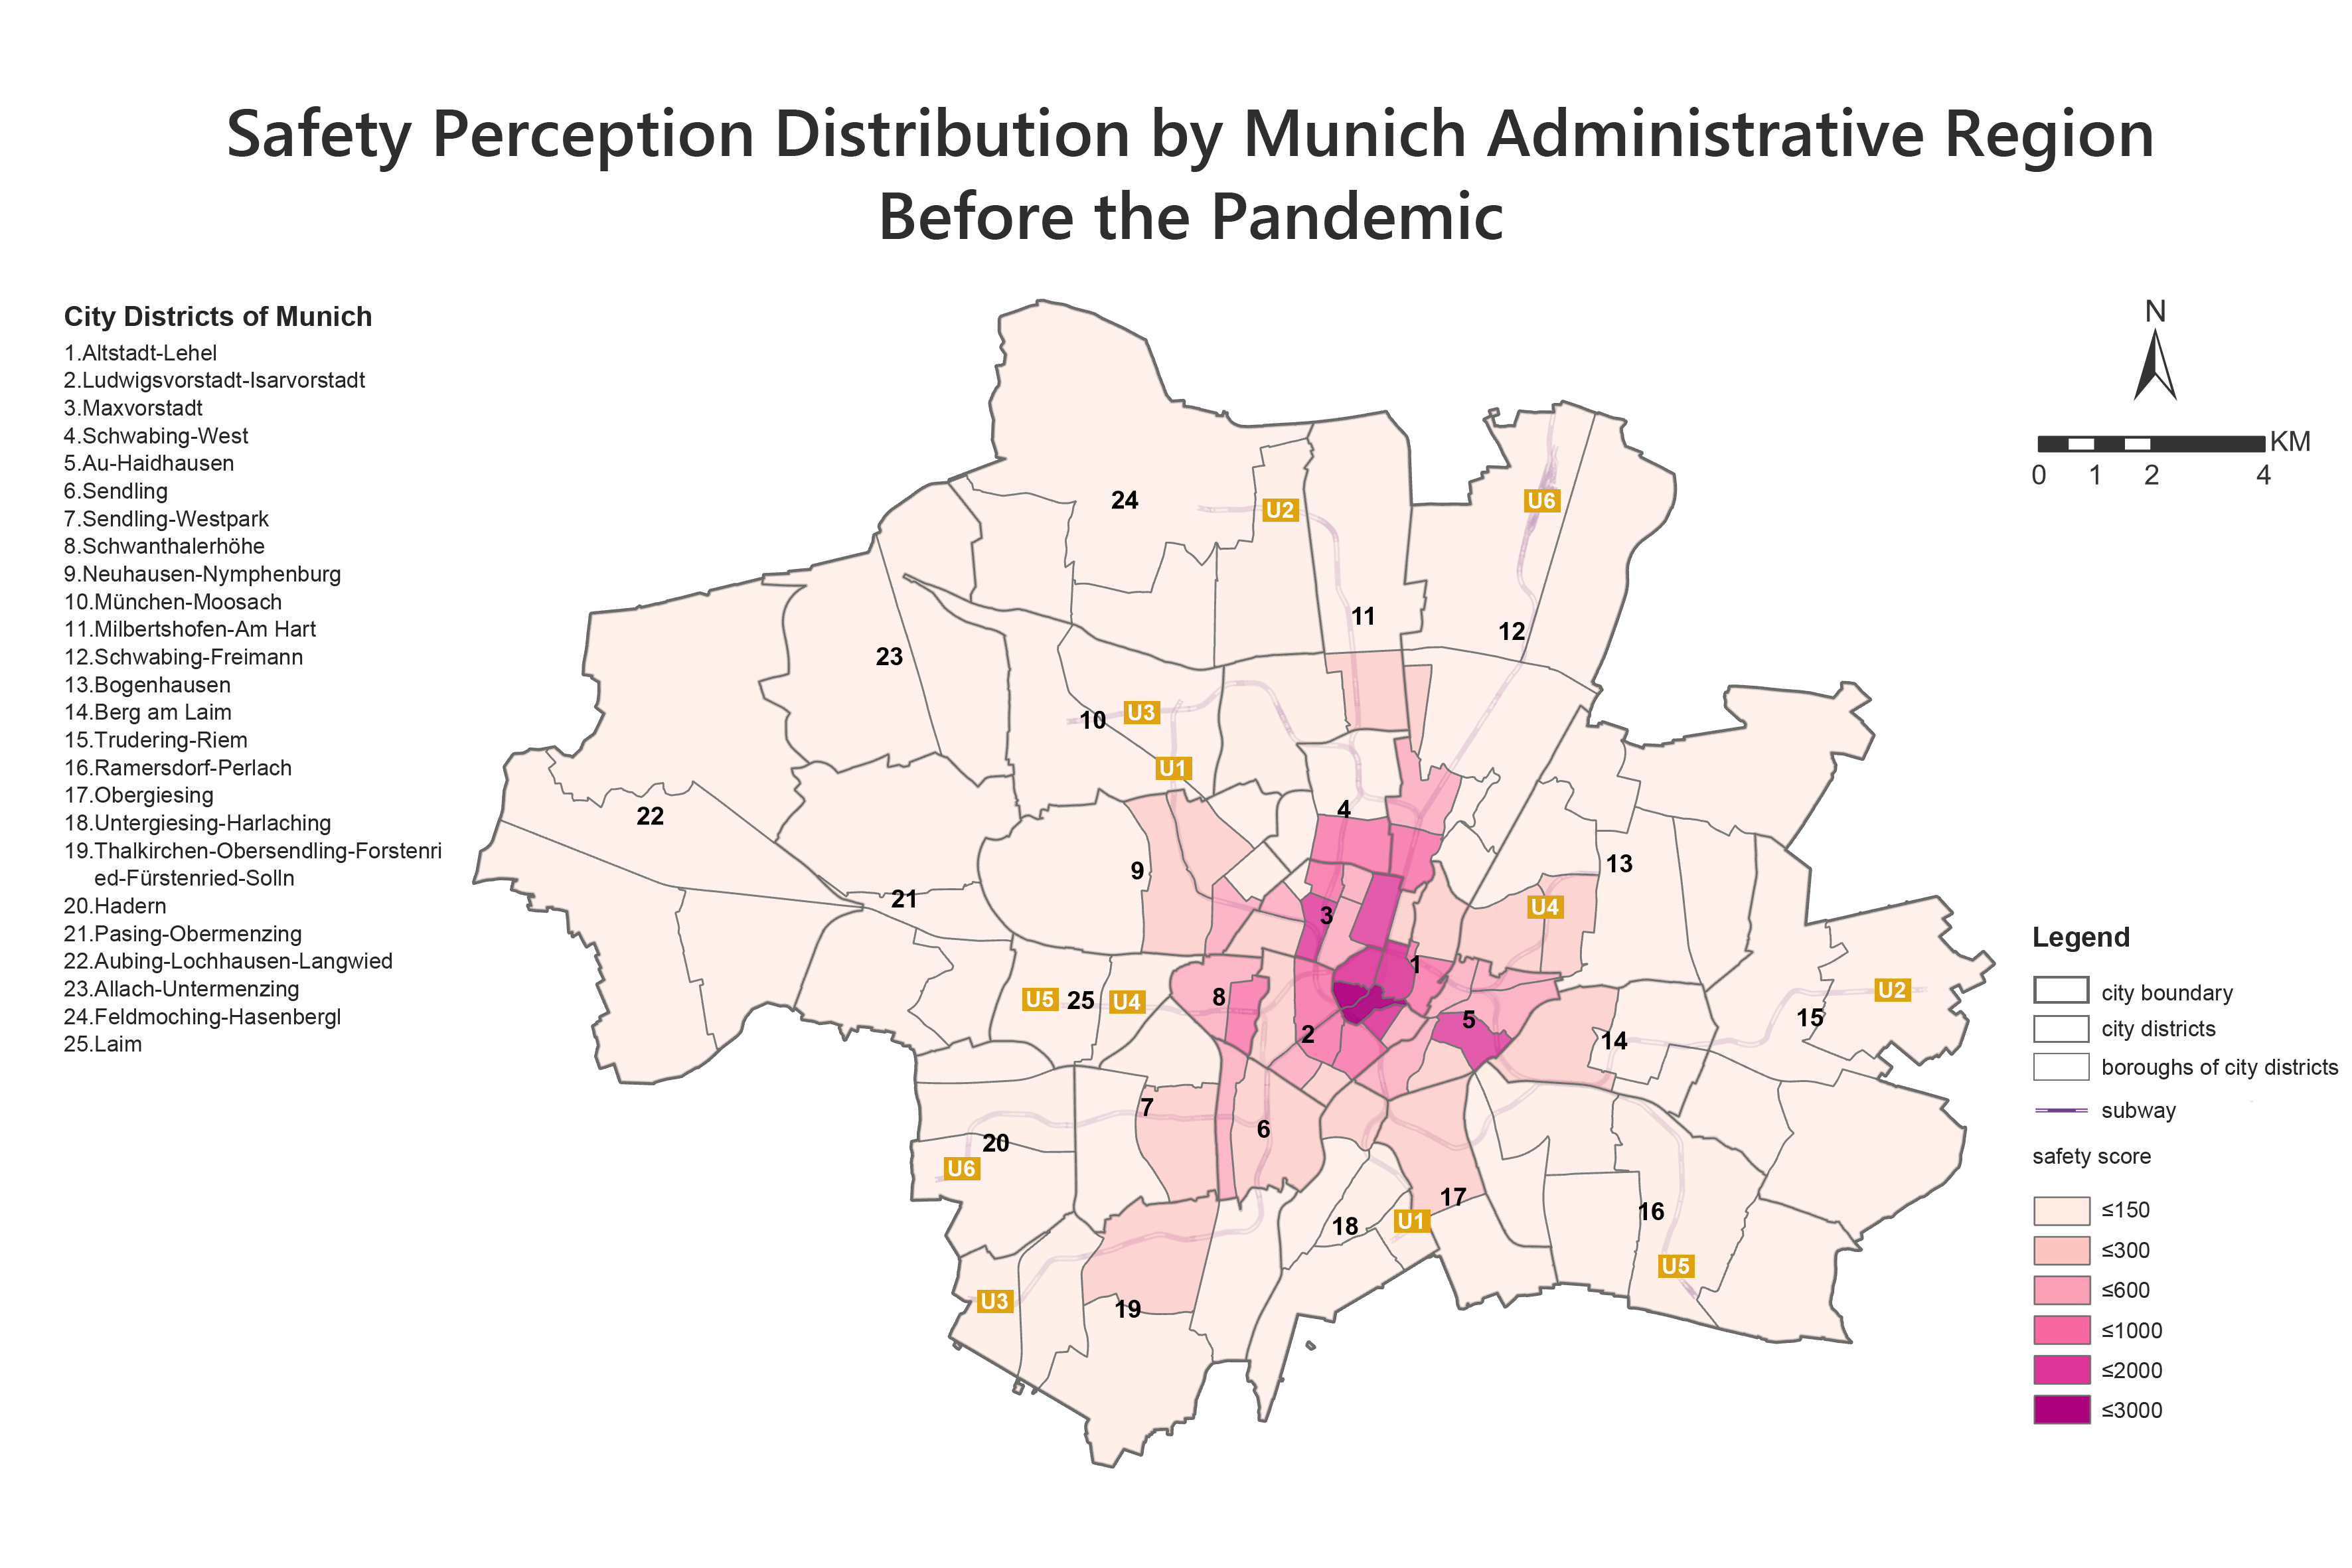
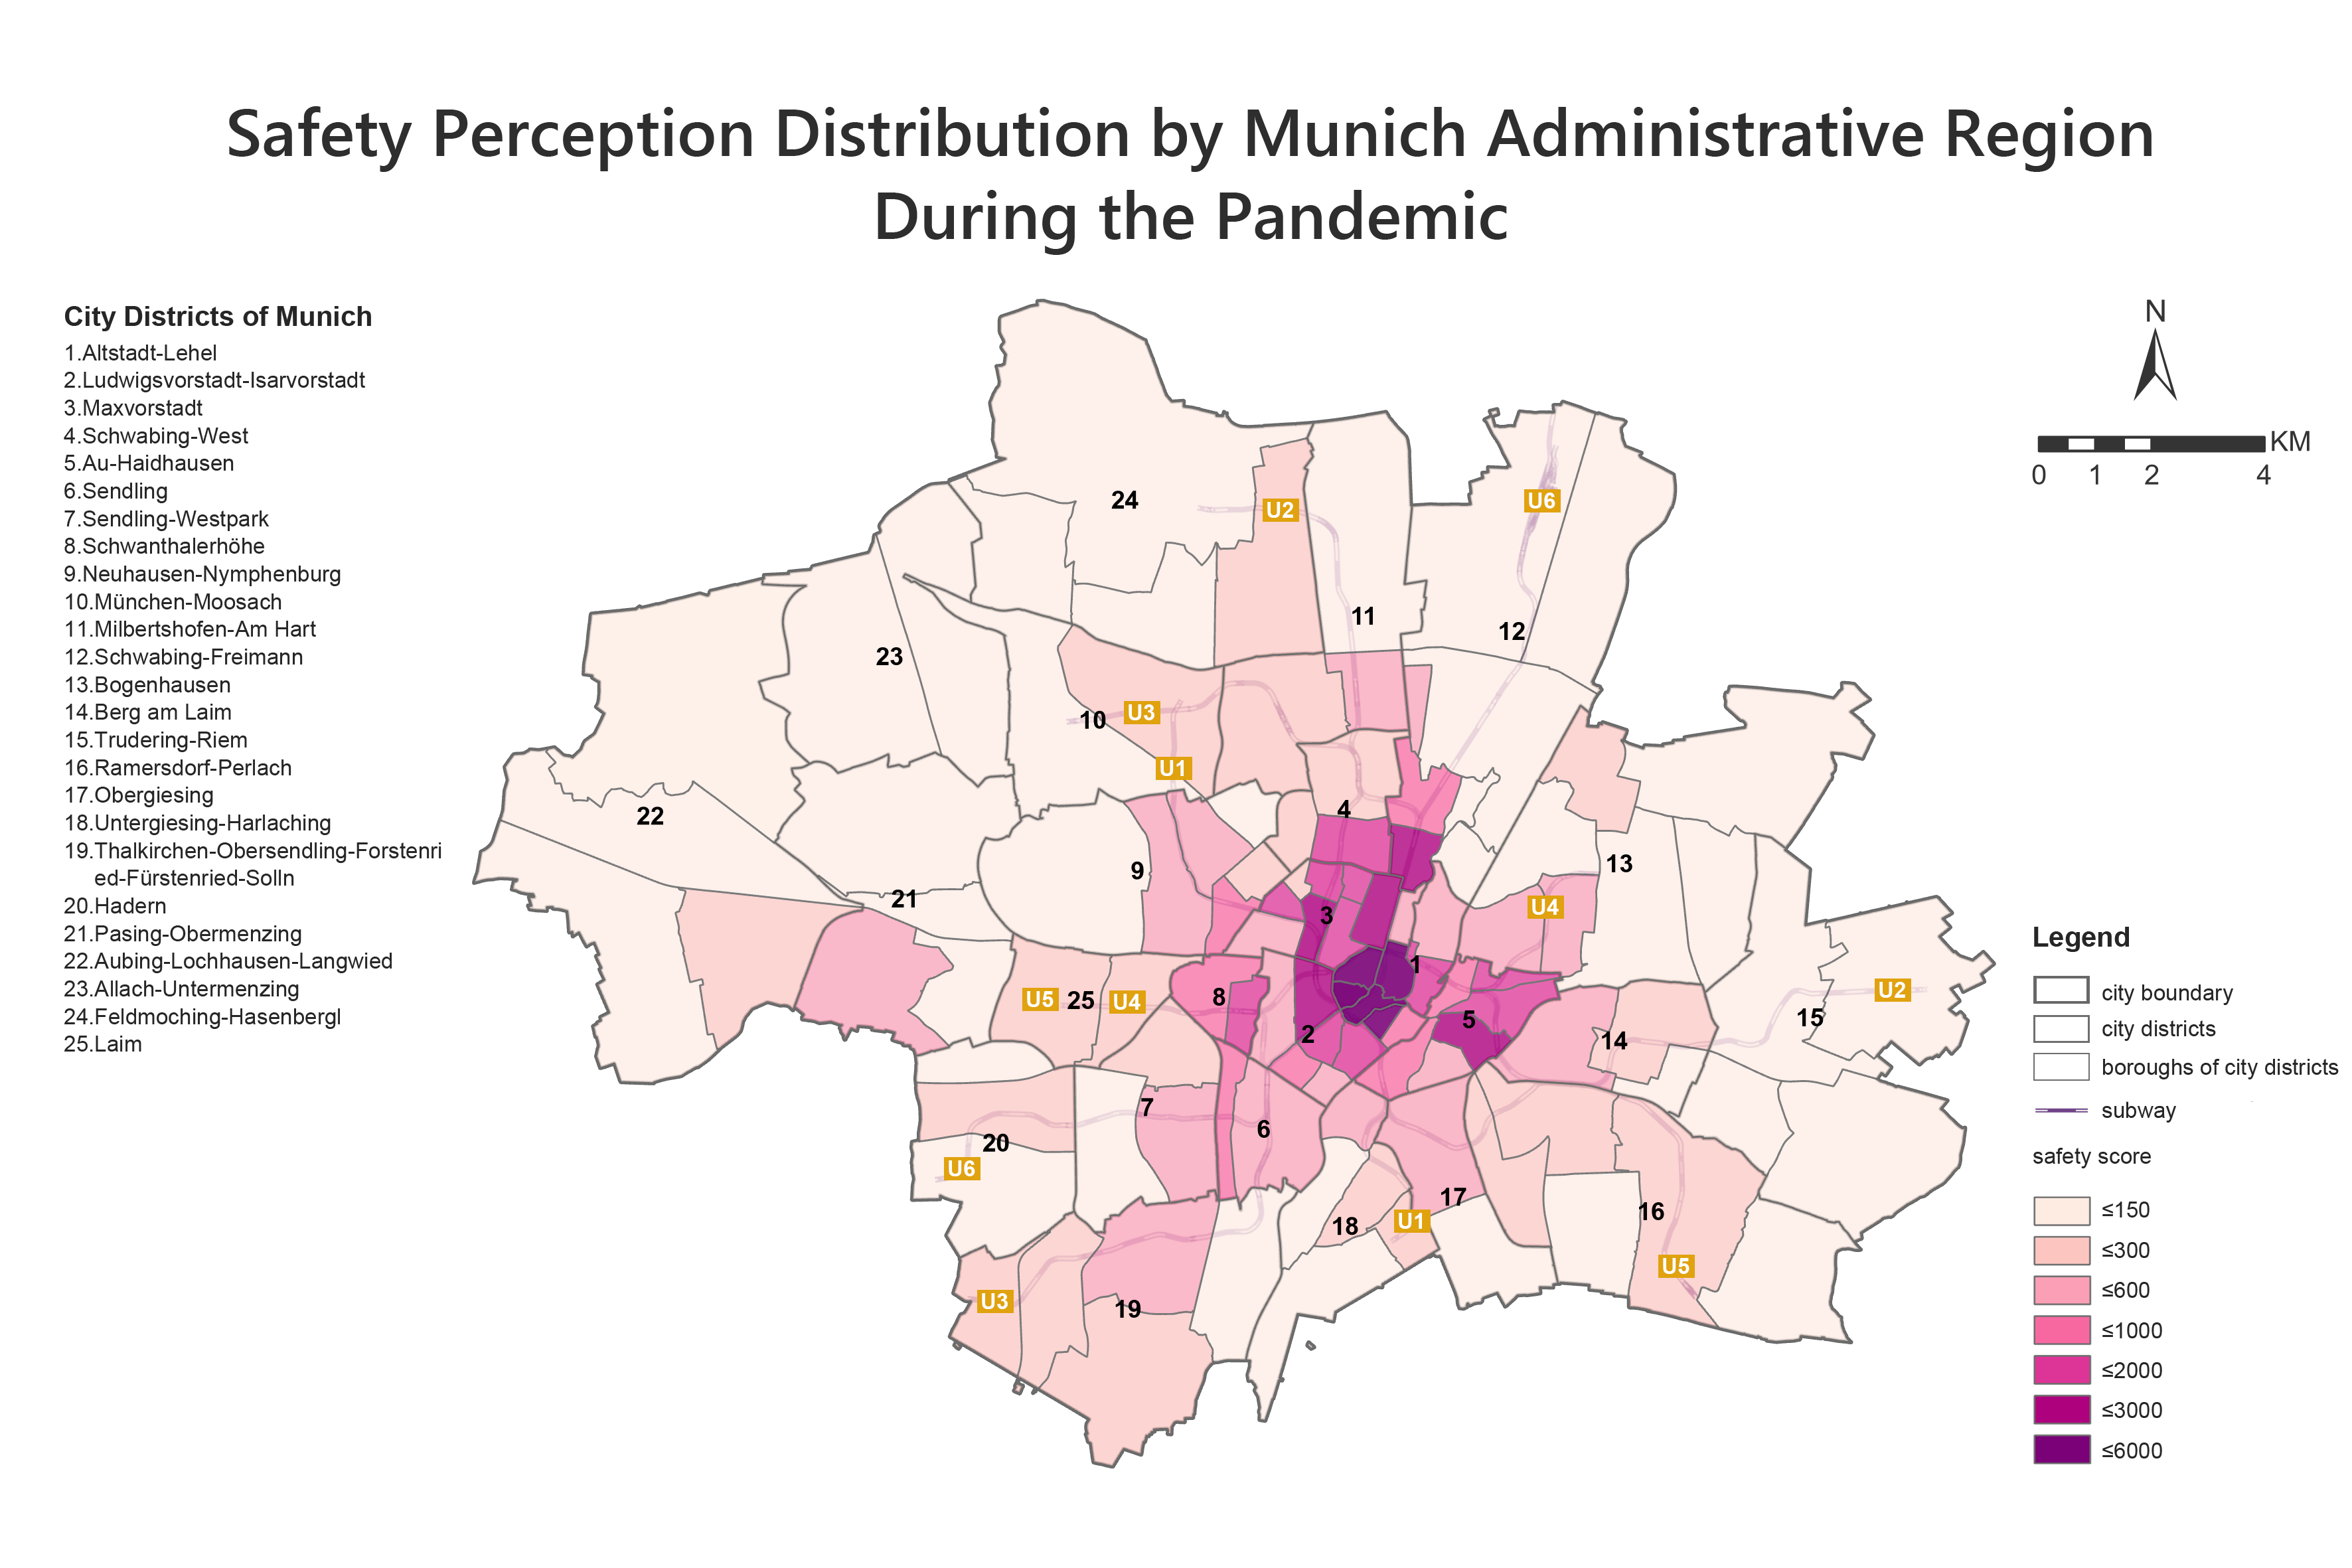
This maps displays on a custome scale which districts in Munich according to public opinion are deemed the most unsafe to go DURING the pandemic Safe areas decreased significantly after the outbreak of COVID-19. Lots of districts became less safer during the pandemic, such as 12(Schwabing-Freimann), 13(Bogenhausen), 15(Trudering-Riem), 16(Ramersdorf-Perlach). At the meantime, several districts stay the same level of safety as before, like 22(Aubing-Lochhausen-Langwied), 23(Allach-Untermenzing). Central areas always perform as less safer places. The less safer area does not change much but the safety scores increase a lot, which means the general safety level declined after the outbreak of COVID-19.
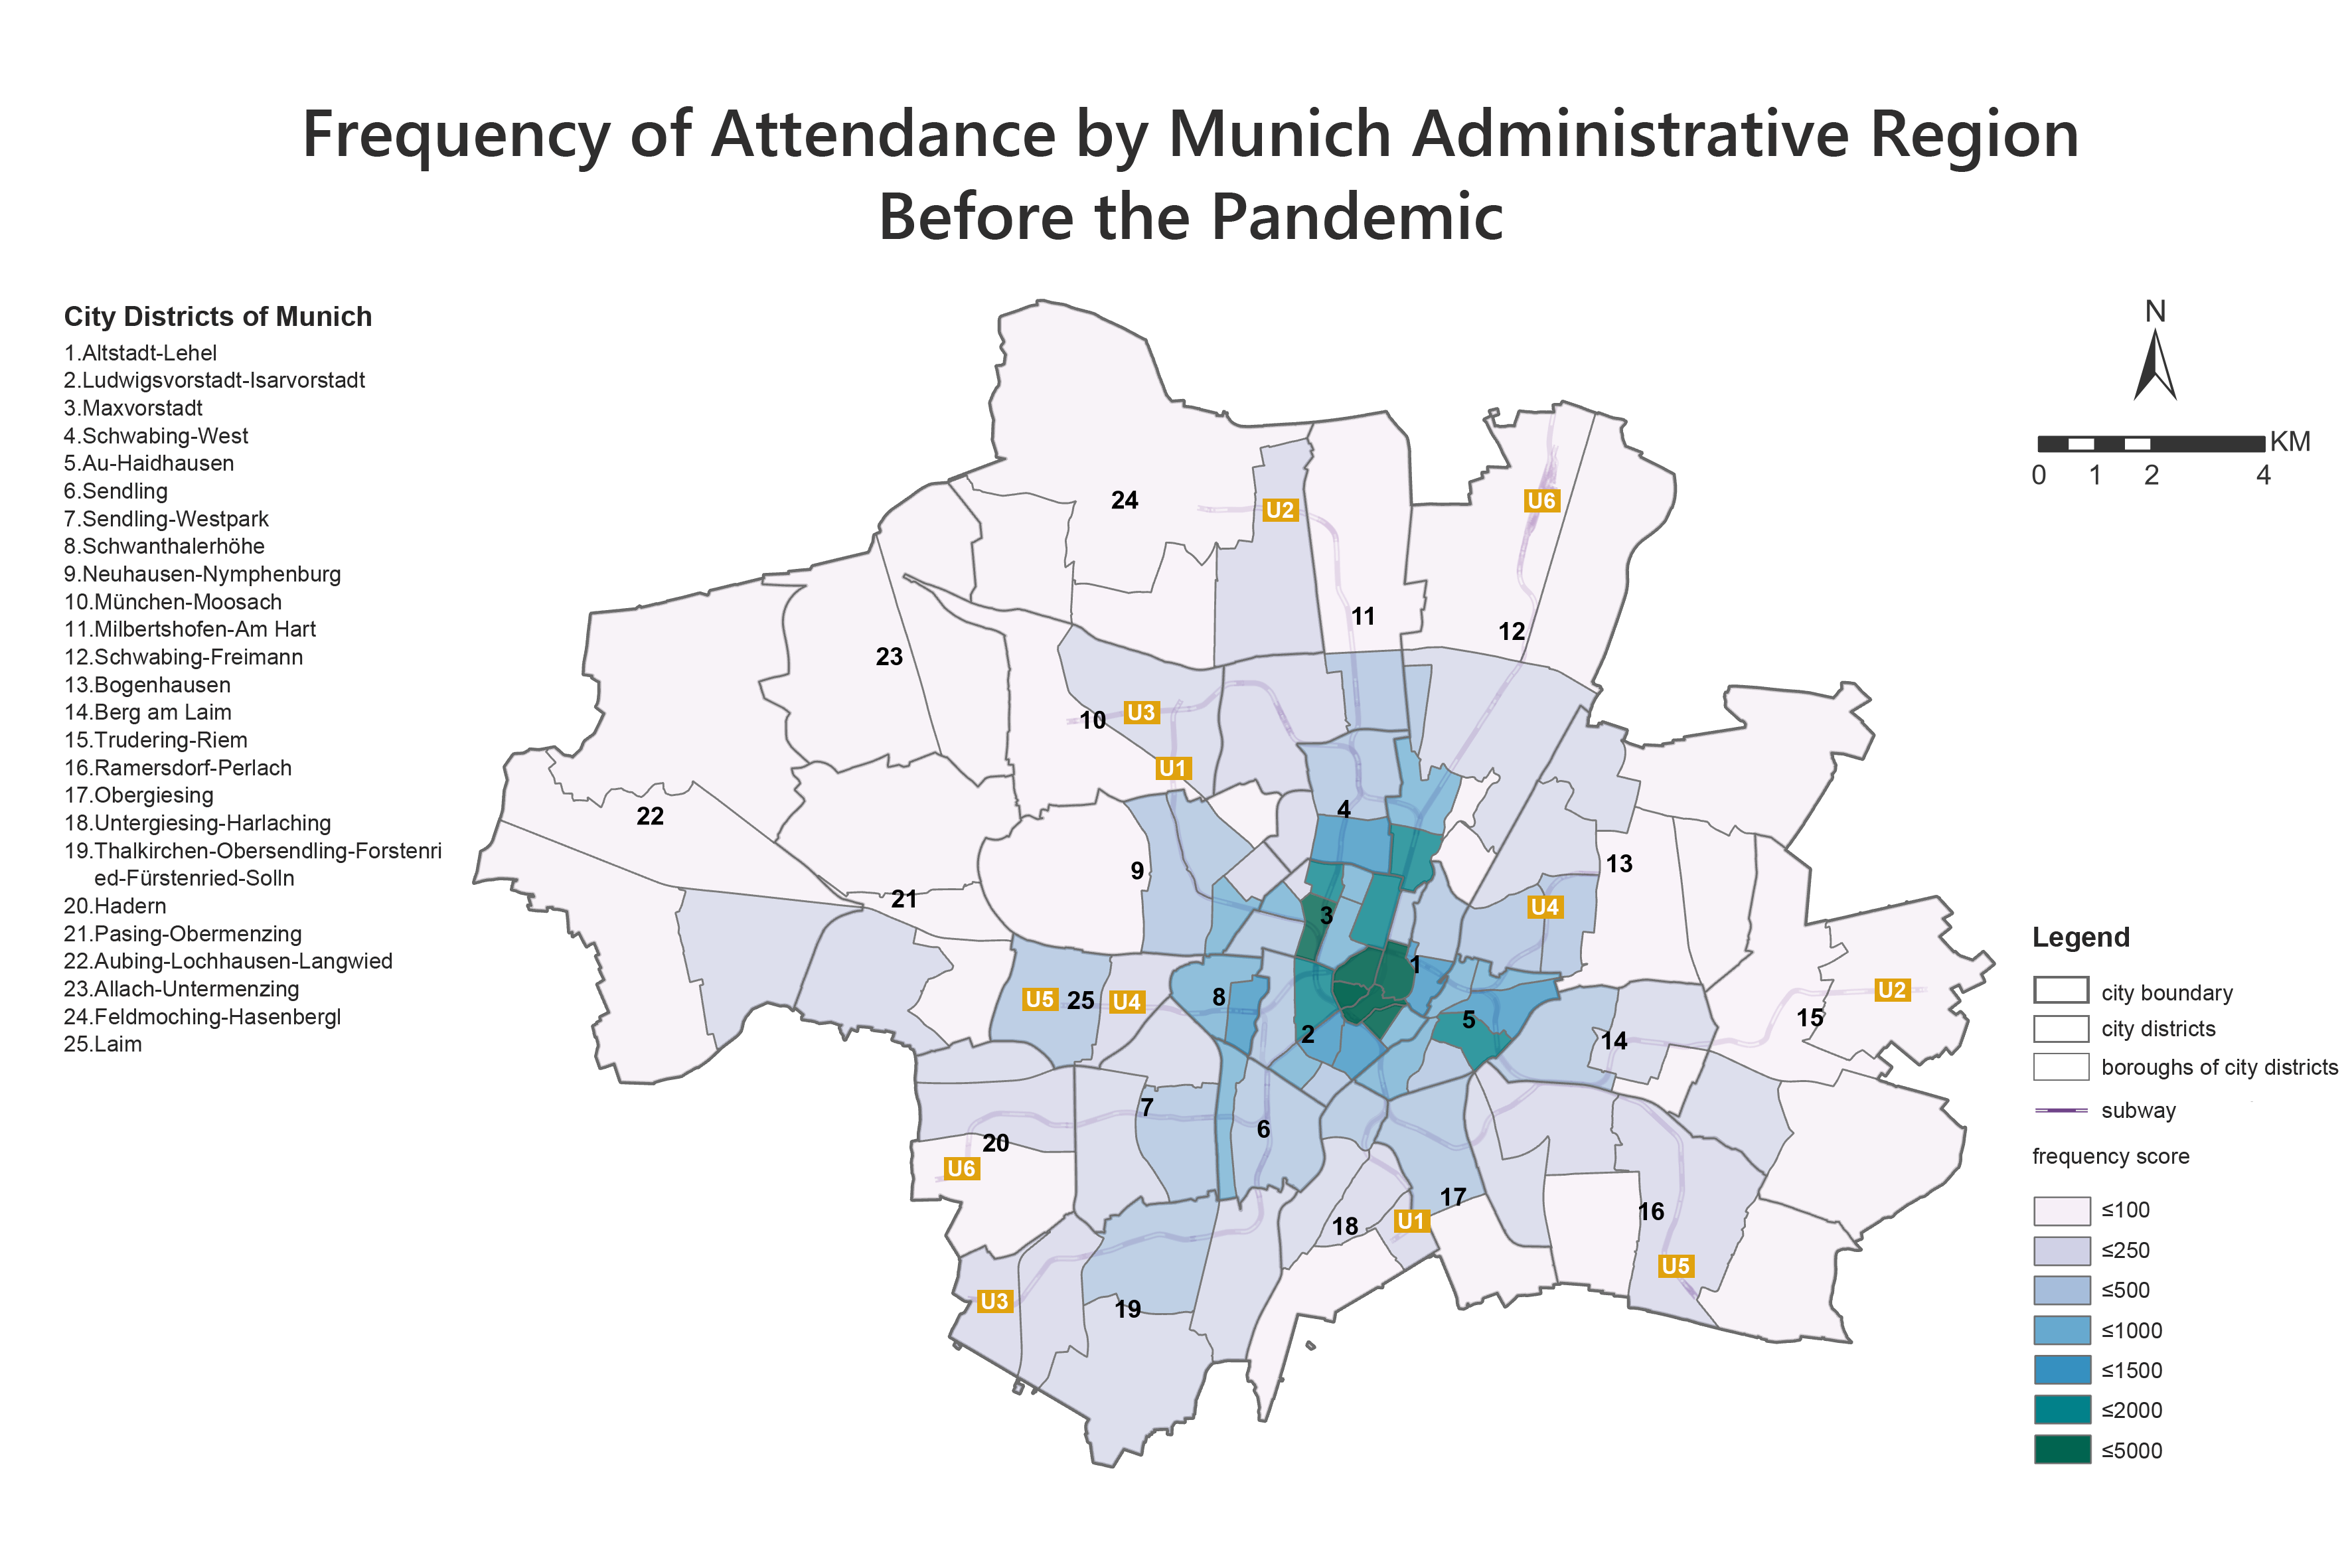
This maps displays on a custome scale which districts in Munich according to public opinion were most likely visited by citizens DURING the pandemic Travelling frequencies decreased but not very remarkably after the outbreak of COVID-19. The general travelling frequencies declined as many districts are with light colors during the pandemic, but the central area of Munich still shows a higher level of frequency especially 1(Altstadt-Lehel), 2(Ludwigsvorstadt-Isarvorstadt), 3(Maxvorstadt), 4(Schwabing-West), 5(Au-Haidhausen).
